
QoE Dashboard. Uplink channel monitoring
In the section QoE Analytics → QoE Dashboard, you can find a collection of all available report widgets in the system.
Here you can display and configure all necessary metrics for convenient monitoring in the form of numeric indicators or charts. In the top menu, you can select the statistics period; by default, it is set to 2 hours.
Widgets can be moved, added (by dragging from the right panel to the left), or removed.
Default dashboard
By default, the “Default” dashboard is configured and contains the following widgets:
- NetFlow → Panels → Traffic speed
- NetFlow → Panels → RTT
- NetFlow → Panels → Subscribers RTT
- NetFlow → Panels → RTT distribution
- NetFlow → Panels → RTT over time
- NetFlow → Panels → Traffic speed
- NetFlow → Panels → Retransmits over time
- NetFlow → Panels → Top subscribers with high RTT (pie chart)
- NetFlow → Panels → Top subscribers with high RTT (table)
- ClickStream → Panels → General data
- NetFlow → Panels → Top hosts (ClickStream)
- NetFlow → Panels → Top devices (ClickStream)
- NetFlow → Panels → Uplink monitoring → Uplink monitoring
Custom dashboards
You can create custom dashboards and fill them with any widgets:
- Click “+” (Add dashboard) on the “Dashboards” panel on the right side of the screen
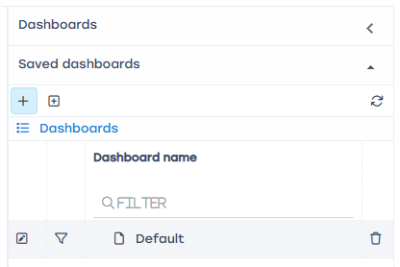
- Fill in information about the new dashboard:
- Enter a name
- Configure access. If “For users with roles” is selected, you can mark which roles will have access to this dashboard

- Click “Save”
- Expand the “Widgets, drag from here” panel, choose widgets you want to include, and drag them to the dashboard.

You can resize widgets by dragging their bottom-right corner.
You can move widgets on the dashboard by dragging their title.
Clicking the ☰ button opens a list of additional actions — you can remove the widget or open its settings (not available for all widgets).
Widgets
Uplink monitoring
Terms and definitions
Uplink (upstream link) — a communication channel between the operator and an upstream or backbone provider, through which the operator accesses the internet.
RTT (Round-Trip Time) — the time taken to send a signal plus the time to receive confirmation that the signal was received. It represents latency between two points.
Purpose
The “Uplink monitoring” service allows you to identify accessibility issues for users in real time without special expertise. Such issues may arise due to:
- Problems or overload on the upstream provider (uplink)
- Slow performance or unavailability of the target service
Getting started
Before using this feature, you need to enable statistics collection. To do this, click the ☰ icon in the top left corner and:
- Select Administrator
- Open QoE Stor configuration
- Go to QoE Stor
- Find Settings for the UPLINK LOAD RATE statistics collection service
- Set UPLINK LOAD RATE statistics collection to Enabled
Then click Save at the top of the screen.

Appearance
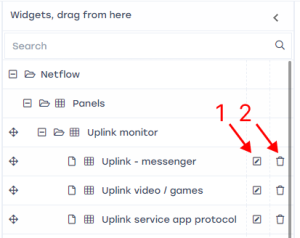
The service is available under QoE Analytics → QoE Dashboard. To add the uplink monitoring widget, choose NetFlow → Panels → Uplink monitoring in the side widget panel and drag it to the dashboard.
Each widget can be configured (1) or deleted (2) from the side panel.
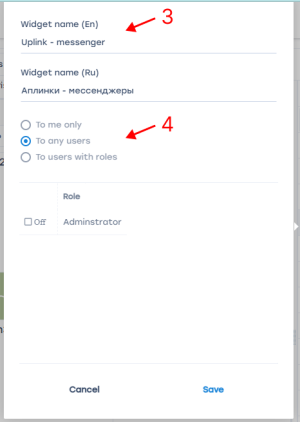
In the widget settings window (1), you can rename the widget in English and Russian (3) and configure its visibility (4).
At the top of the screen, you can select the time period for displaying traffic (5) and choose the data source (6).

For each protocol, the following data is displayed:
- Name of the protocol (7)
- Traffic volume for the selected period (8)
- Median RTT to the subscriber, ms (9)
- Traffic delta, % (10) — difference between the current traffic and the typical value for the same time and day of the week
- Overall service health score (11):
- 0–3 points — good (green curve)
- 4–7 points — satisfactory (yellow curve)
- 8–10 points — poor (red curve)
- Curve showing changes in the health score over time (12)

Configuring protocols in the widget
When hovering over a widget, a ☰ icon appears in the top right corner. Clicking it allows you to access settings or delete the widget.

Clicking Settings opens the configuration form. Here you can see a list of protocols (1), up to 10 per widget. To display more, add additional widgets — for example, one for messengers/social networks, another for streaming, etc.
You can add (2) or remove (3) any protocols from the standard dictionary. For each protocol, you can configure scoring based on traffic delta (4) (0–2 points depending on traffic change) and RTT metrics (5). The RTT parameter is more significant and allows finer adjustment for latency-sensitive services.
Each protocol can also be assigned an importance category (6), which adds 0–2 points to the total score if the combined traffic and RTT scores are above zero. The categories reflect the service’s sensitivity to quality issues:
- Category 1 — very popular, highly sensitive to connection quality or interruptions.
- Category 2 — niche but known, moderately sensitive to quality.
- Category 3 — emerging service, content quality not critical.
Recommended default values for the impact of traffic delta (%) and RTT thresholds are provided by the developer, then adjusted by the operator as needed.

What to do in case of issues
When problems are detected early, the provider can resolve them by:
- Switching to another uplink
- Prioritizing traffic (applying “emergency” policies)
- Contacting the uplink provider to report the issue
RTT description
Round-Trip Time (RTT) — the total time for a signal to be sent and acknowledged, i.e., the delay between two points within a single flow.
A *flow* in DPI is all network activity within a source/destination socket (source IP:port / destination IP:port).
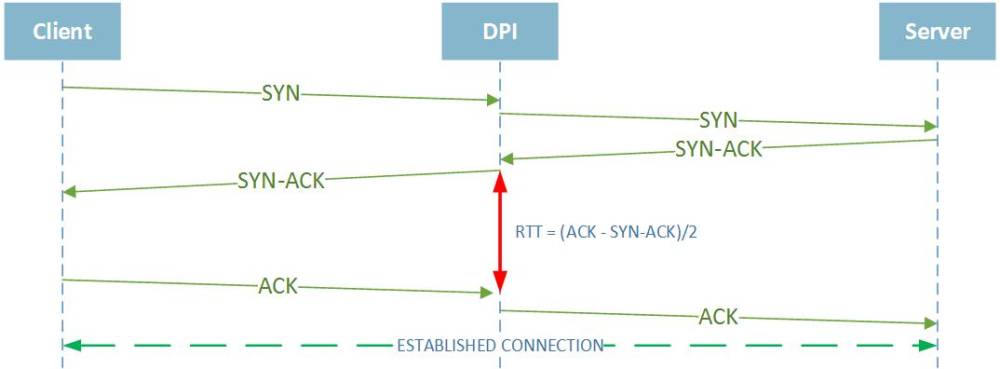
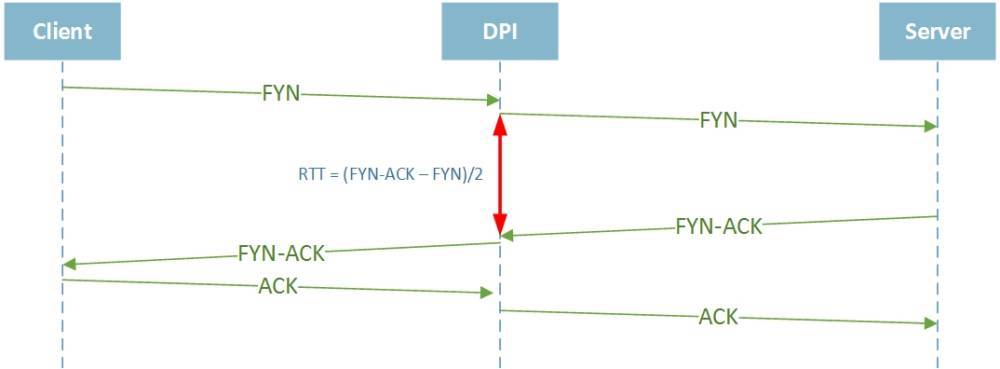
Since all traffic between the client and server passes through the DPI, RTT is calculated in two directions:
- From the client to DPI (labeled from subscriber in GUI)
- From the server to DPI (labeled to subscriber in GUI)
Each new flow on DPI is registered not upon receiving a TCP SYN from the initiator, but upon receiving a SYN/ACK response, so RTT is calculated based on message transmission and acknowledgment times.
The client may act as a server and vice versa depending on who initiates the TCP connection (TCP SYN). Accordingly, the RTT calculation logic changes as well.
!!! Important: RTT is calculated only for session-oriented (TCP) connections. It is not calculated for UDP.
RTT from subscriber to DPI
RTT to subscriber — from server to DPI (if termination was initiated by the client)
TCP protocol features and RTT calculation
Due to TCP specifics, many conditions can affect RTT calculation for a particular flow.
RTT from client to DPI equals zero for some flows
 This happens if DPI does not receive an ACK from the client for a sent SYN/ACK.
It may occur if the client closed the connection physically or sent a RST packet.
In such cases, DPI records “0” for RTT from client to DPI for that flow.
This happens if DPI does not receive an ACK from the client for a sent SYN/ACK.
It may occur if the client closed the connection physically or sent a RST packet.
In such cases, DPI records “0” for RTT from client to DPI for that flow.
Some flows have very high RTT values (tens of seconds)
 For example, this may occur during a TCP HALF CLOSED CONNECTION, when one side stops sending but still receives data. The transmitting side may send FIN/ACK only after finishing all data transfer, leading to a high RTT value.
Retransmission description
- Overall retransmission percentage
- Retransmissions from subscriber traffic
- Retransmissions to subscriber traffic
 Retransmission types:
- TCP Retransmission — standard packet retransmission. If the sender does not receive an ACK within the retransmission timer, it resends the packet, assuming it was lost. The timer adapts dynamically to the network’s RTT, as defined in RFC6298 *Computing TCP’s Retransmission Timer*.
- TCP Fast Retransmission — the sender immediately retransmits packets upon assuming loss, without waiting for the timer to expire. Typically triggered by receiving three duplicate ACKs with the same sequence number.
- Spurious Retransmission — introduced in Wireshark v1.12, means the sender retransmits packets that have already been acknowledged.
Was this information helpful?